pseudoiterative wrote: Sun Oct 26, 2025 6:43 pm
Damodaran recently published an interesting blog post focused on valuation of US equities. Whenever I read Damodaran’s writing about valuation I learn something. This post focuses on different perspectives of valuation, and also on market timing.Damodaran looks at US equity valuations from a few perspectives, ranging from simplistic (looking at the price chart of the index in isolation) to more sophisticated (estimating intrinsic value based on net present value of forecast earnings growth).
Damodaran writes that market timing is an impossible dream — the last part of the post proposes a simple market timing rule to switch between 80/20, 60/40 and 40/60 asset allocations, where the rule compares the current CAPE value with the median CAPE value from the previous 50 years, and chooses 80/20 if the current CAPE is 25% lower the median, 40/60 if the current CAPE is 25% higher than the median, and 60/40 otherwise. Damodaran backtests this rule using Shiller’s historical S&P 500 dataset & CAPE values and finds that over the last century, this market timing rule underperforms an investor who would hold a static 60/40 allocation, even before accounting for the market timer’s higher burden of transaction costs and taxes.
Damodaran explores a few variations of this simple CAPE based timing rule (e.g. making it flip between 100/0 and 0/100 portfolios with 10% bands, etc) and again backtests them, and finds that over the last 50 years, they all would have underperformed an investor holding a static asset allocation.
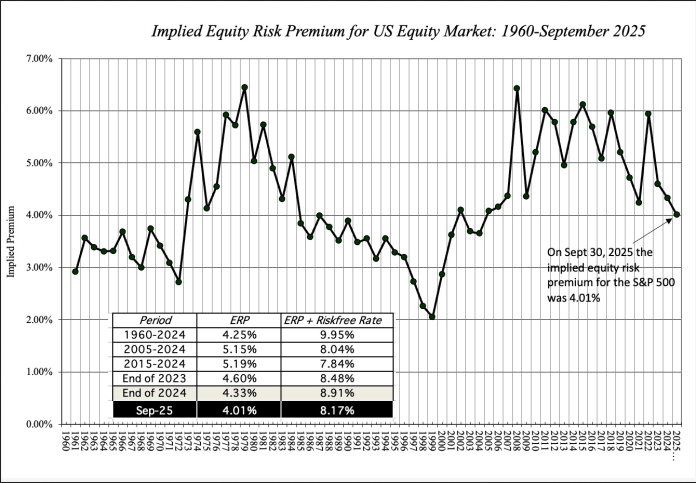
The part of this blog post I got the most out of was the section about estimating the intrinsic value of the S&P 500 index. There are two perspectives: one is that you can assume a particular equity risk premium (Damodaran uses a historical average of 4.25%) and combine that with a simple NPV model of earnings growth over the next 5 years to produce a S&P 500 intrinsic value estimate, then compare that intrinsic value to the market’s current S&P price. The other perspective is to ask what equity risk premium would be necessary to make the S&P 500 price equal to the intrinsic value estimate, to back out an implied equity risk premium given the current market price and analyst’s earnings growth assumptions. Damodaran applied the latter method to estimate implied equity risk premiums for the S&P 500:
Implied equity risk premium for US equity market, 1960 – September 2025
(if you cant see this imgur hosted chart, you can see this chart via Damodaran’s blog)
Damodaran clearly explains the math and modelling assumptions behind this intrinsic value estimate, if you’ve ever tried to cobble together a basic spreadsheet financial model for discounted future earnings, including terminal value, it should be fairly legible.
Damodaran’s estimate of intrinsic value of the S&P 500 for Sept 30, 2025, obtained by setting the equity risk premium to 4.25% (historical average), was $5938, vs the market’s price of $6688, so by this estimate of the intrinsic value of expected earnings, the S&P 500 was overpriced by around 12.6%.
Valuation models based on discounted future earnings tend to be heavily sensitive to choices of some parameters. One of the assumptions in this model is the expected growth rate of earnings, which was taken as 8.94% (from analyst’s forecasts) then extrapolated forward over 5 years. Personally, I’m somewhat sceptical about analyst earnings estimates. Earnings are difficult to forecast accurately even over short time horizons such as 1 year (let alone 5 years), and when analysts make errors they tend to over estimate earnings rather than underestimate them (arbitrary example: this study from 2024 found that over the last 10 years, analyst attempts to forecast earnings 1 year into the future have a relative error of around 69% vs the actual earnings (pdf link)) . Out of curiosity I looked at historical 5 year nominal S&P 500 earnings growth rates from Shiller’s historical dataset. Over the last century, the annualised nominal earnings growth over 5 years was 6.26% (50 percentile), 1.72% (25 percentile), 10.10% (75 percentile). If we plug in those three different historical estimates of annualised earnings growth rates into Damodaran’s S&P 500 intrinsic value model, we get three different intrinsic value estimates
Code: Select all
assumed annual earnings		estimated S&P 500	S&P 500 market price


growth rate for next 5 years	intrinsic value		/ intrinsic value


	 1.72%				$4,298			1.56


	 6.26%				$5,282			1.27


	10.10%				$6,252			1.07
None of these make the S&P 500 seem like a bargain pick for the value investor, but the S&P 500 could be about fairly priced if it turns out S&P 500 companies can, on average, achieve 10% earnings growth per year over the next 5 years.
What has always made sense to me since I first saw it was simply using a turned-around form of the Gordon Growth Model: the current dividend yield (VOO = 1.12%) + historical earnings growth rate (let’s use your median of 6.26%) = expected future nominal returns of 7.38% for the S&P 500. So in today’s world maybe 4.3%-ish real? So if you’re getting about 4% from bonds (BND YTM is 4.4%, average coupon 3.8%) that’s about a 2.8% real return on a 50/50 VOO/BND portfolio (4.4 + 7.38 = 11.78/2 = 5.89 – 3.1% = 2.79%), which most people don’t do, but there it is.


